❌ No photoshop was harmed during the making of these visualizations
Electrophysiology data
Replicate a famous illustration in R using ggplot
Replicate another famous illustration in R using ggplot
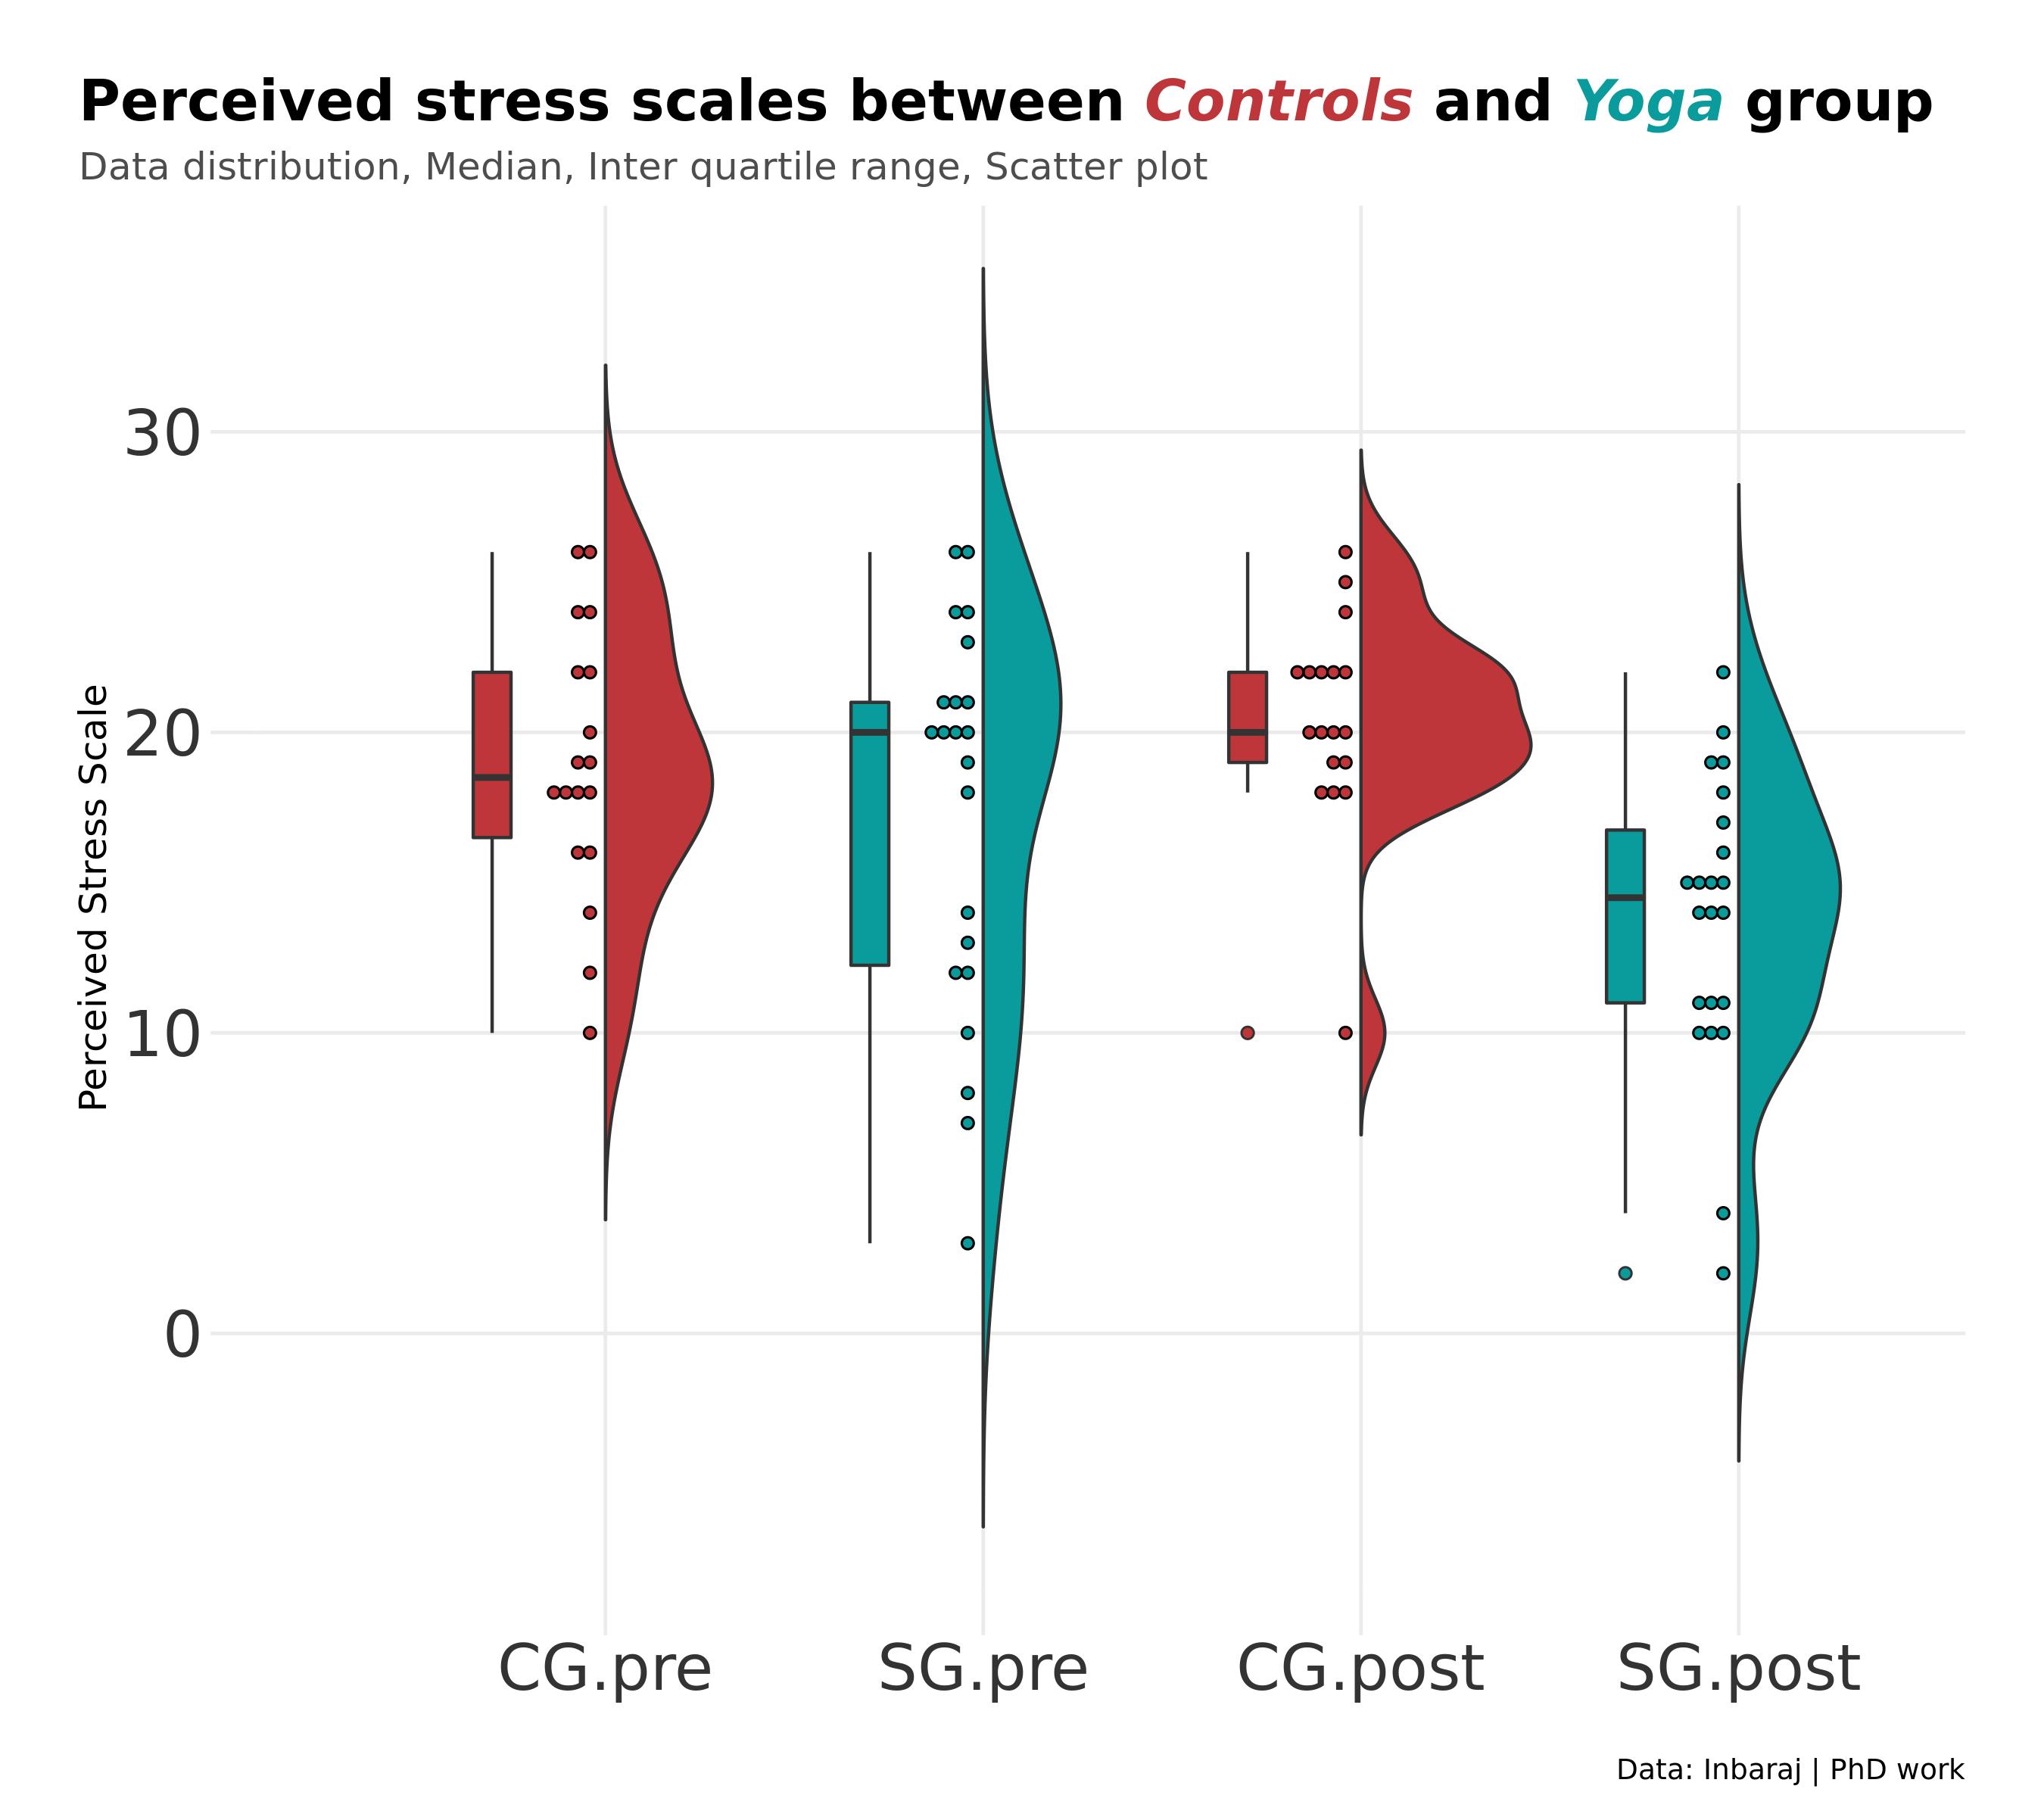
Custom coloring of title and rainbow cloud plots
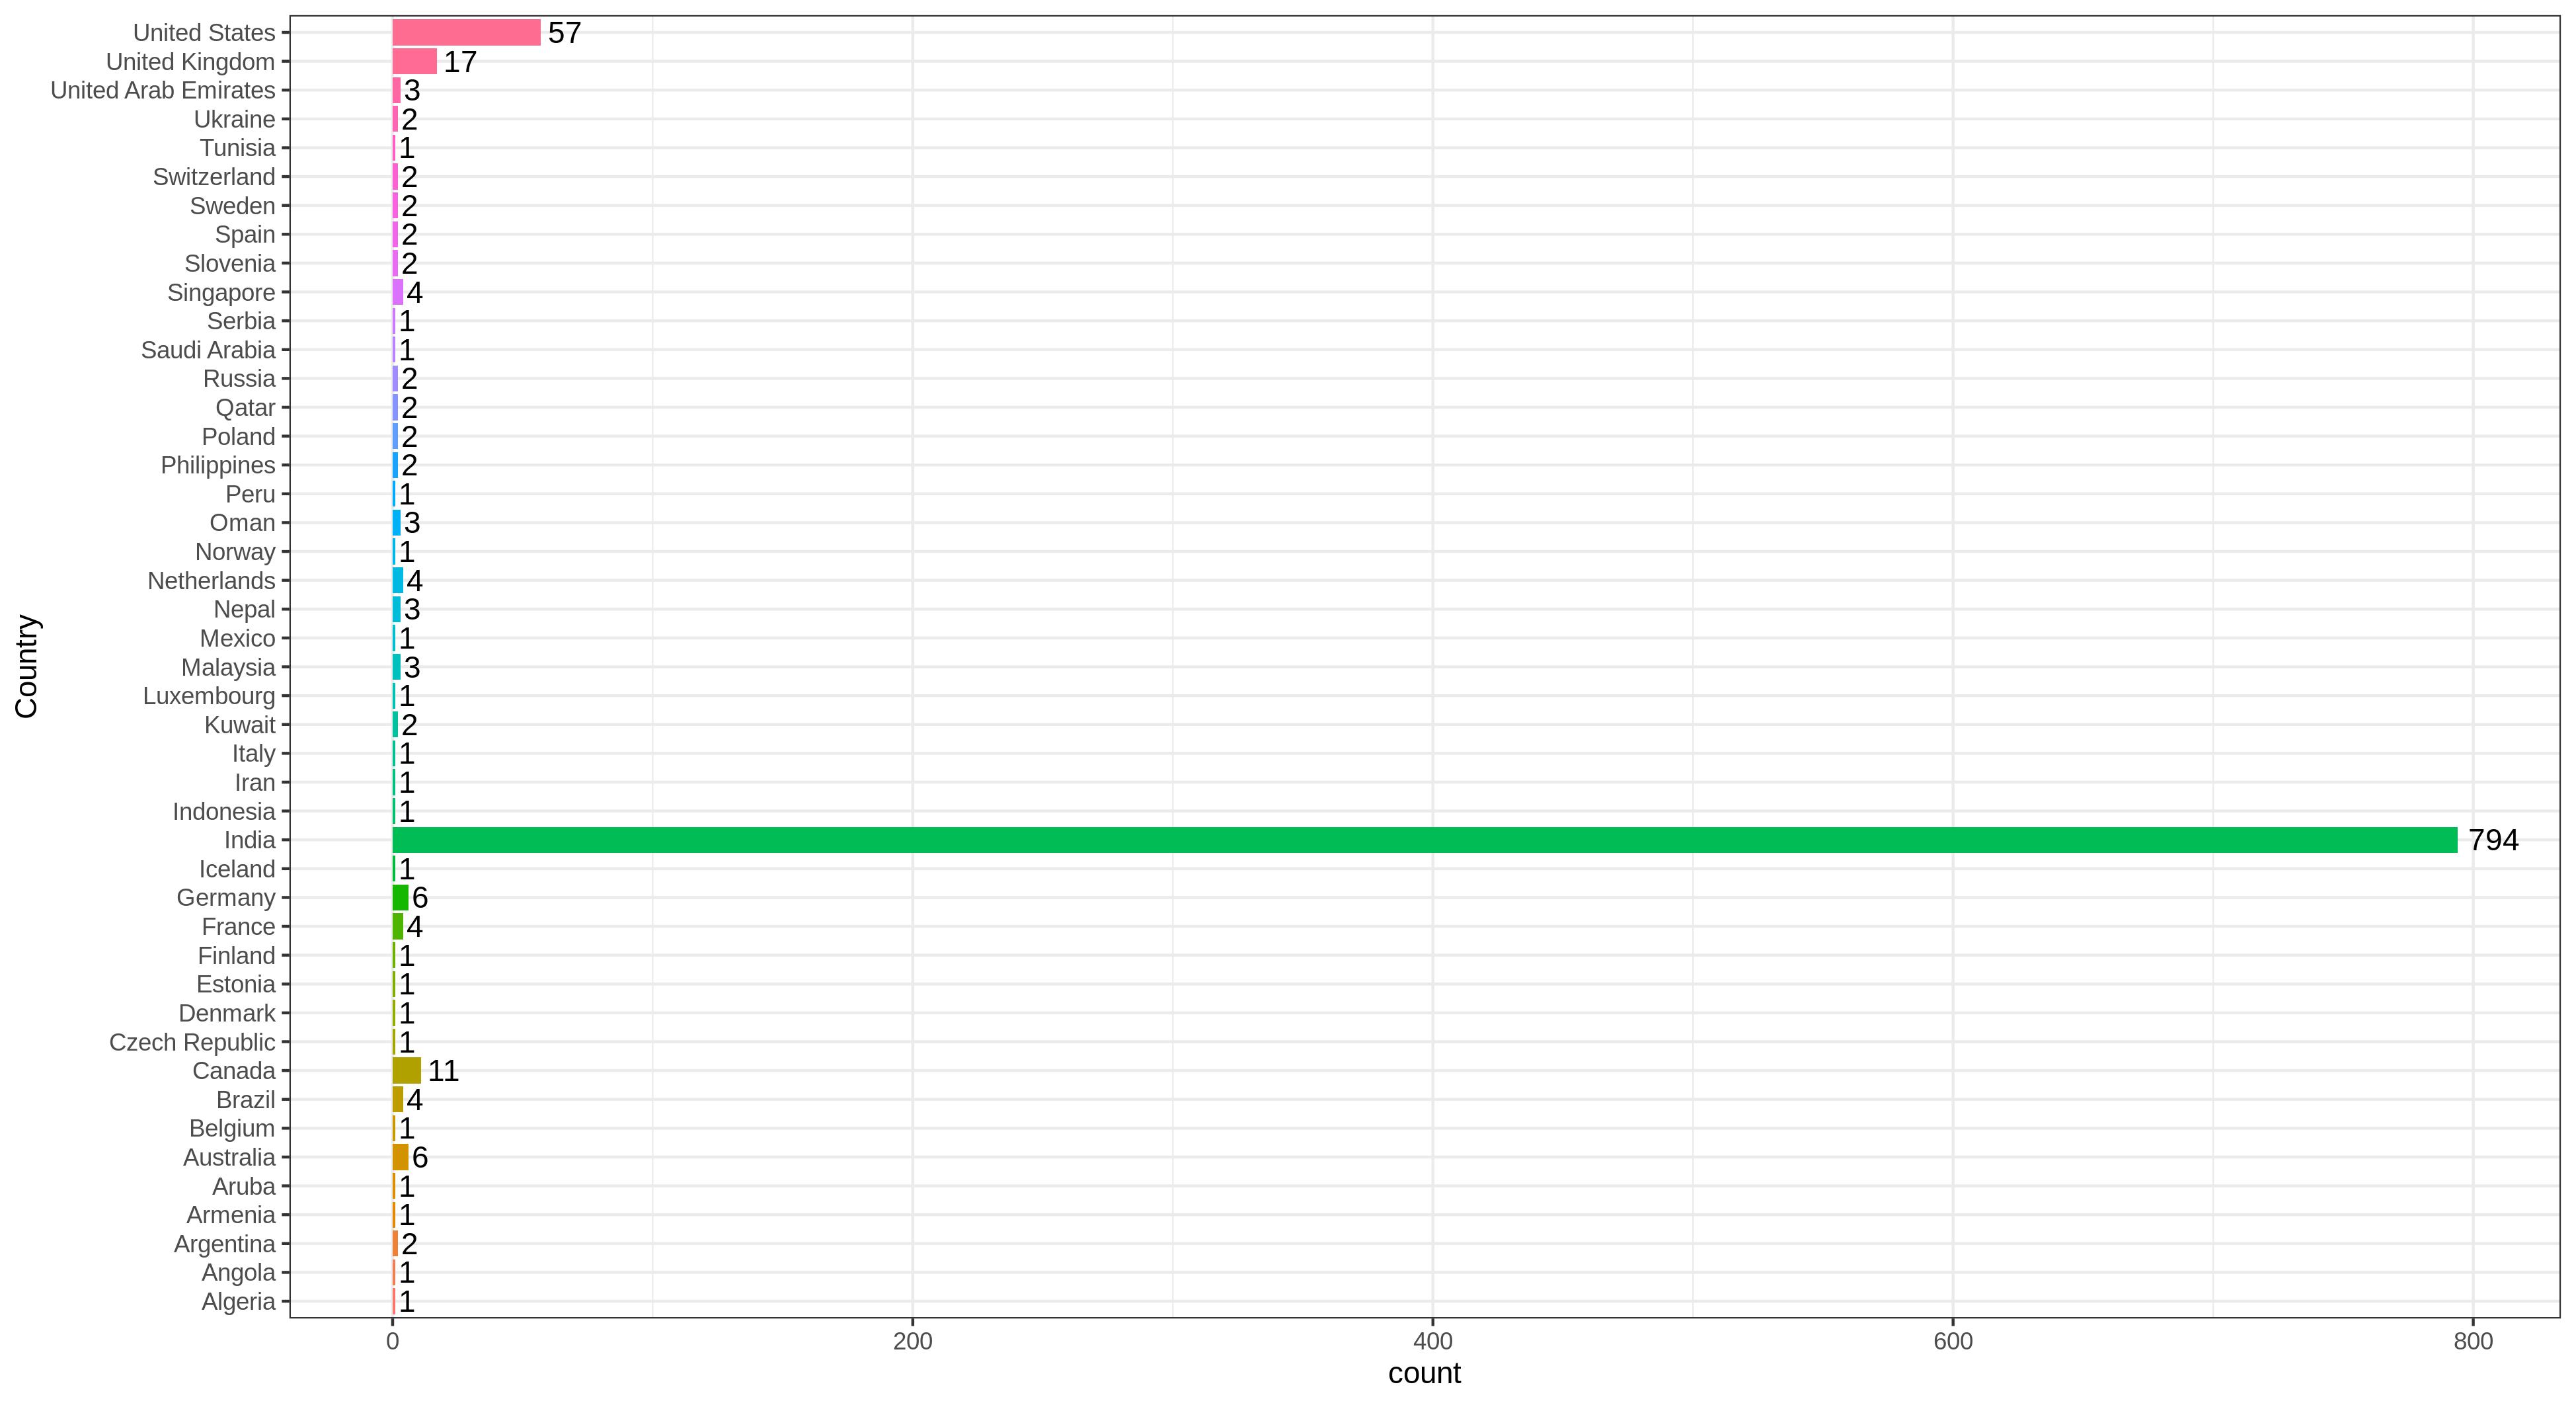
Count number at the end of the bar and horizontal flip for more space
Template for correlation plot
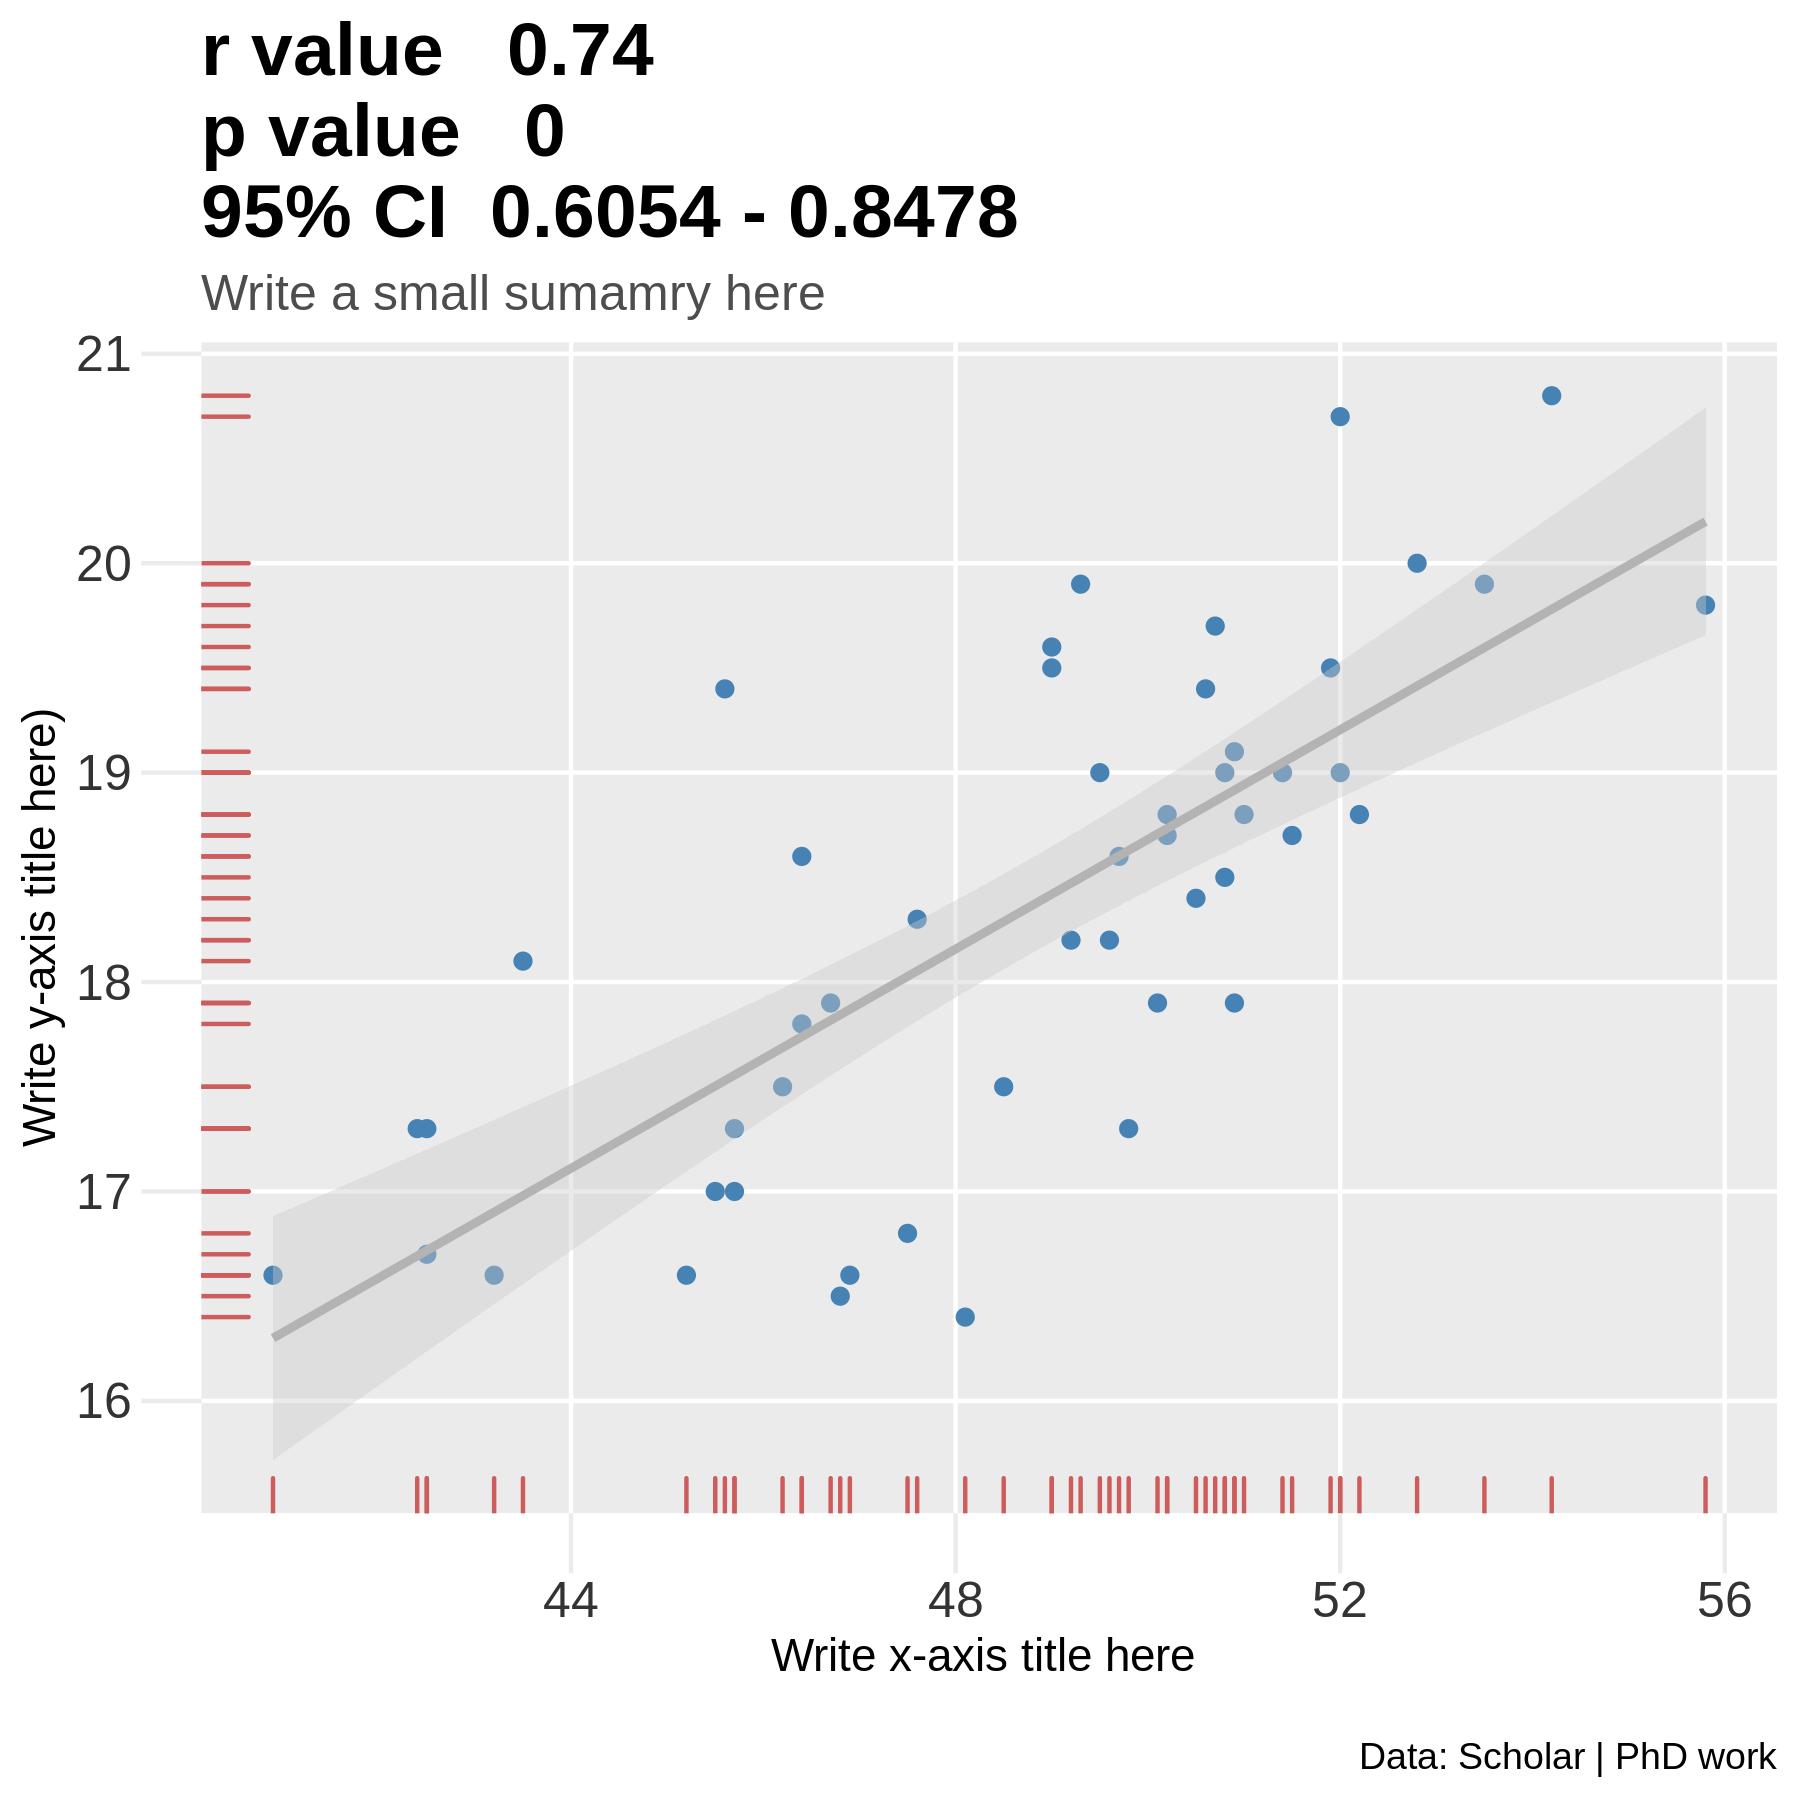
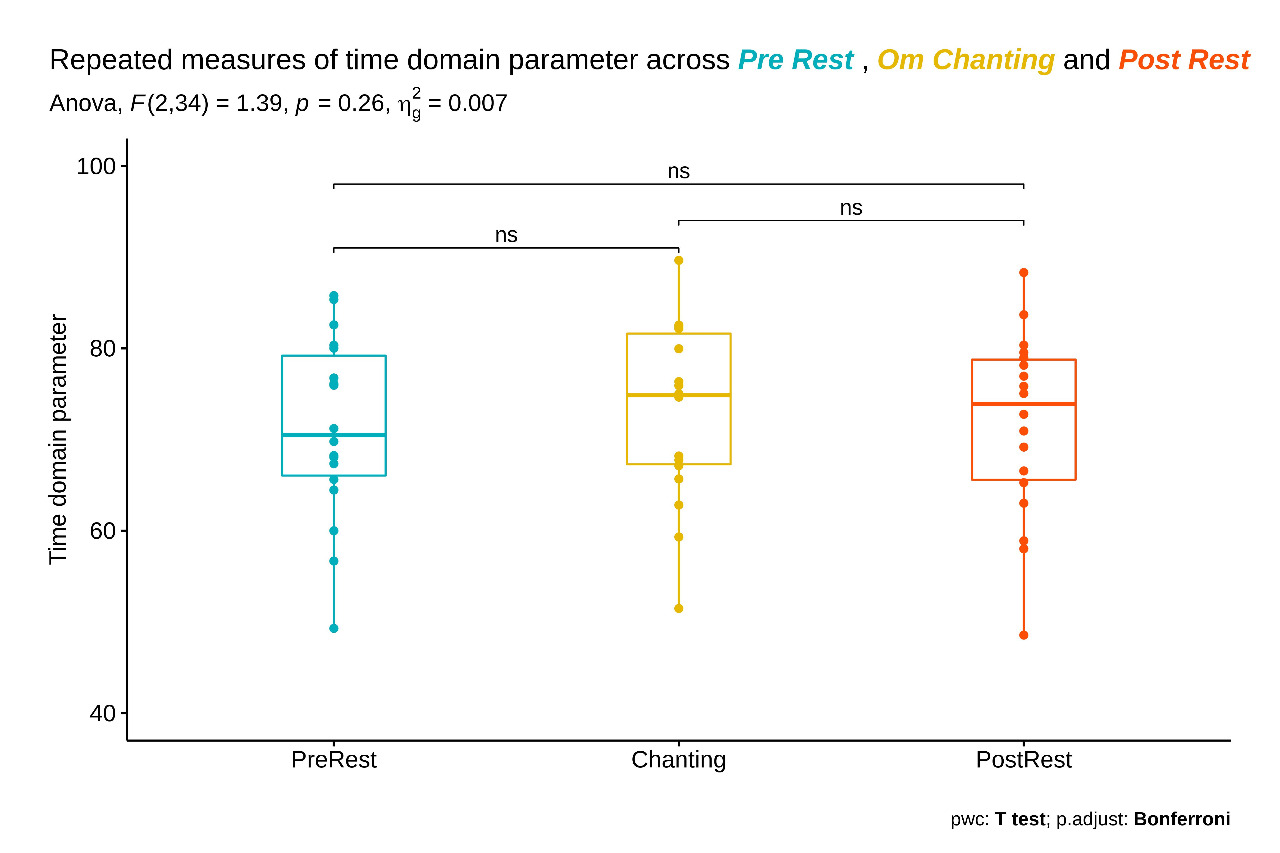
Statistics results onto the plot
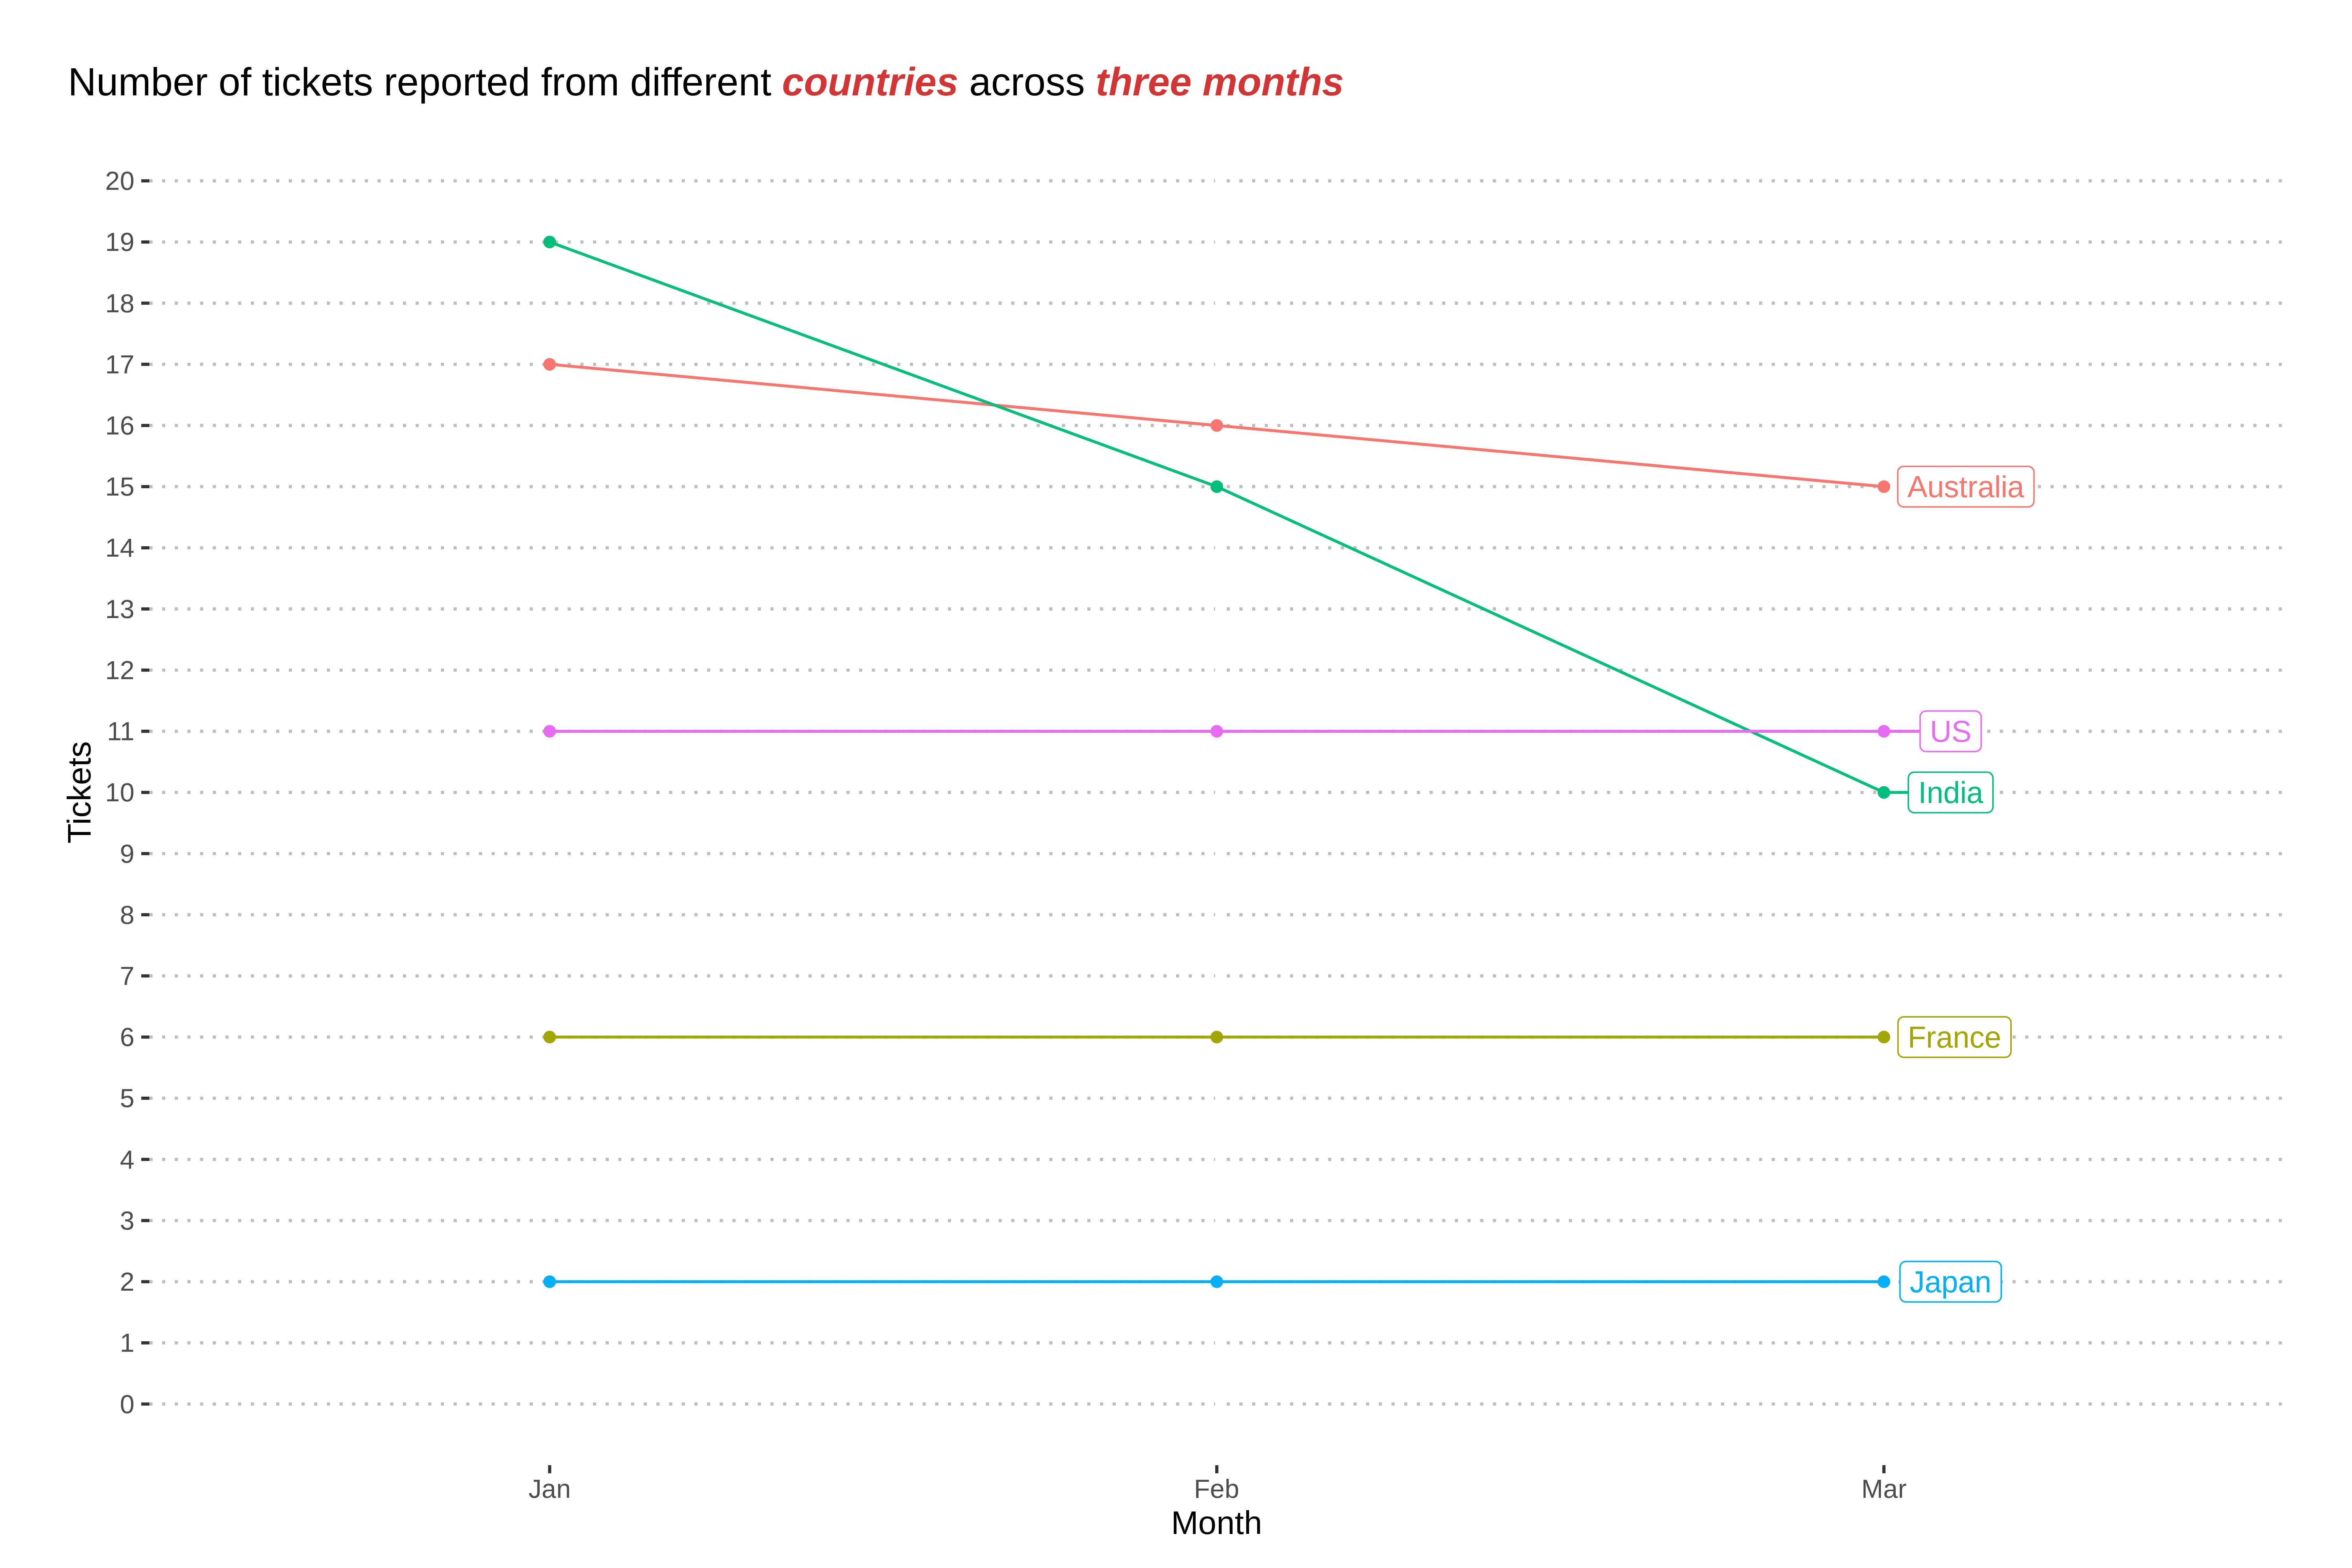
Office visualisation for pending tickets autolabelled
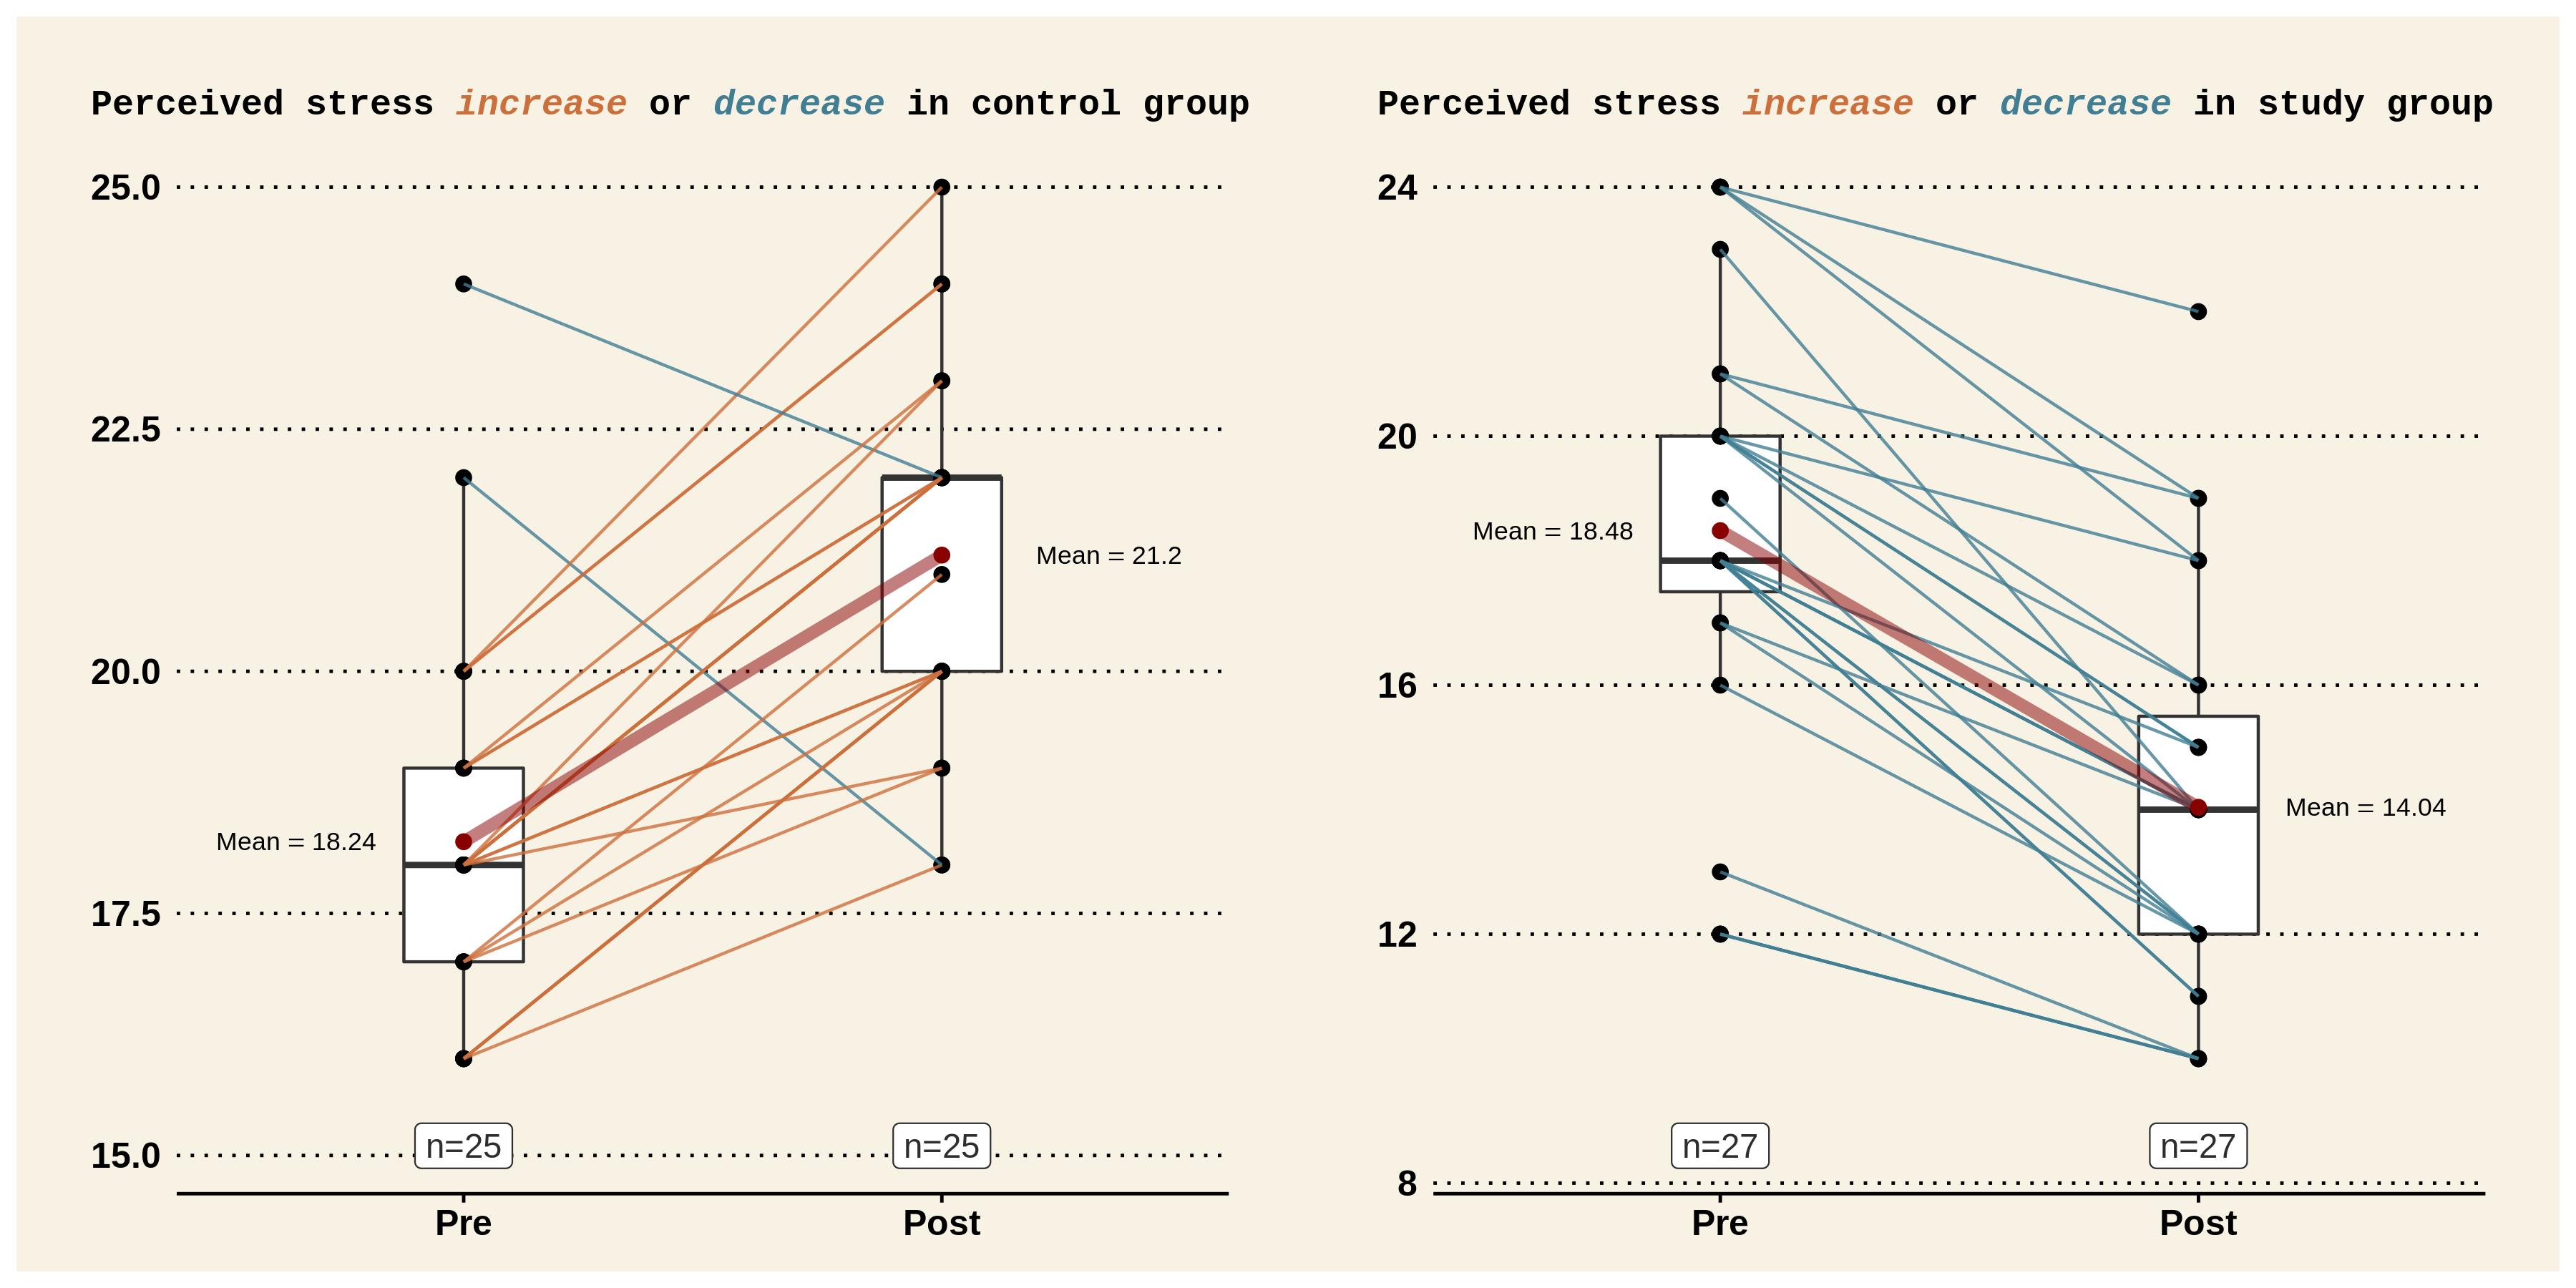
Connected lines for paired data
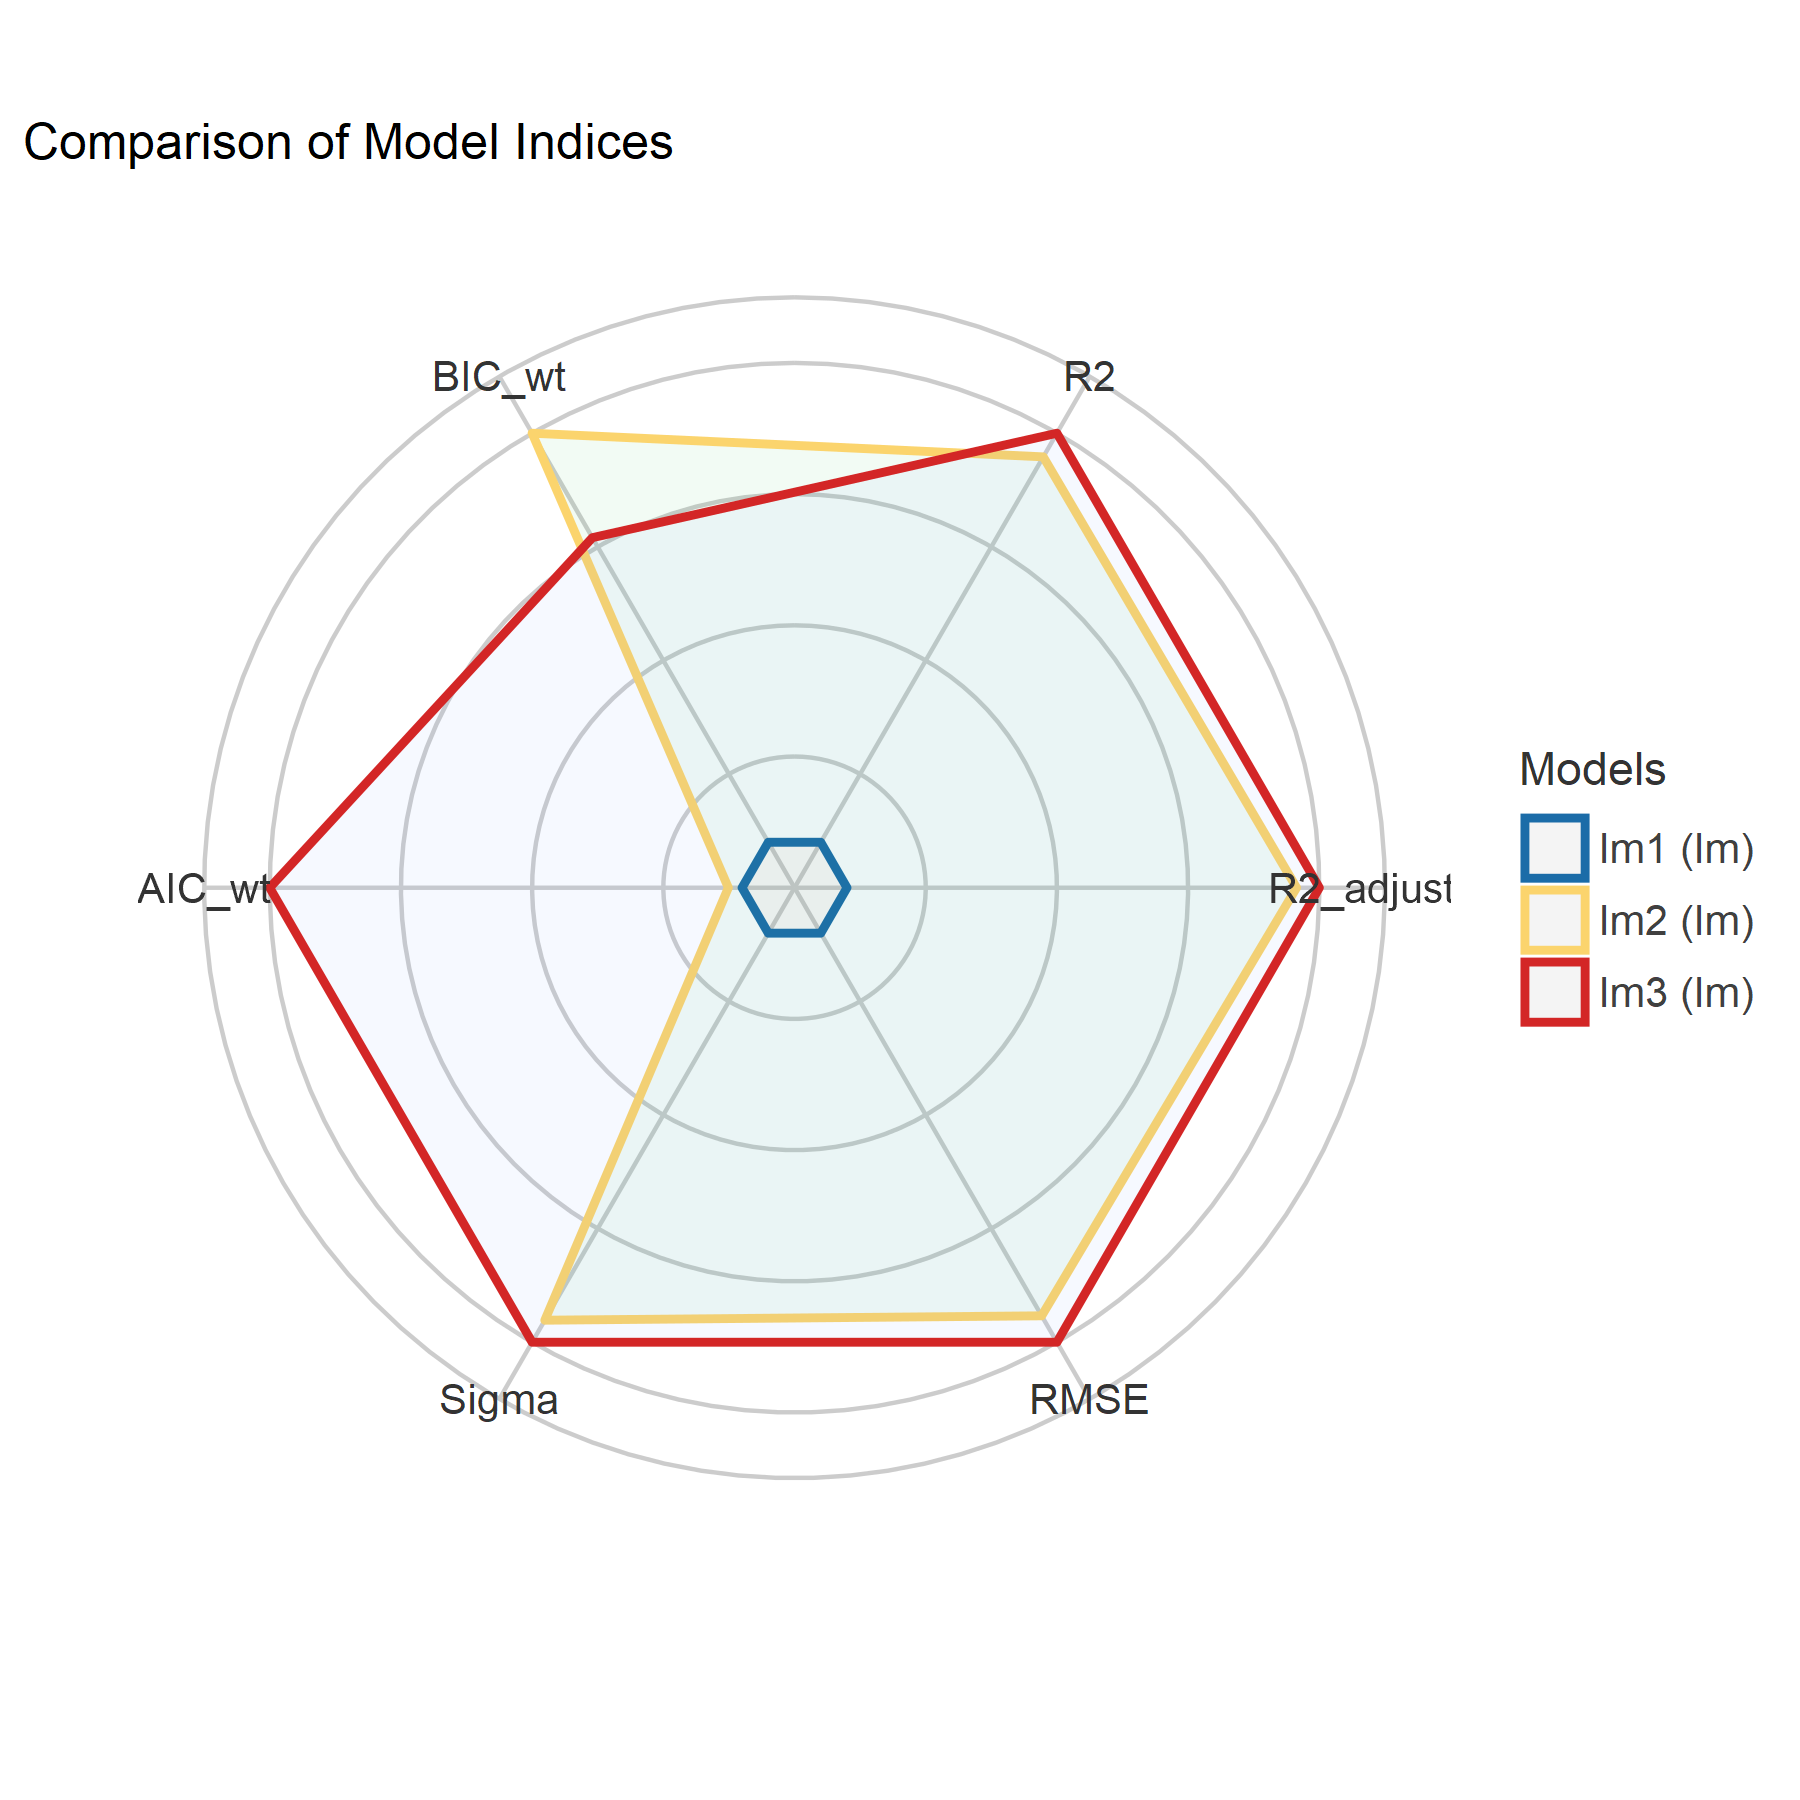
Comparison using radar plot. Useful for parameters with similar scales
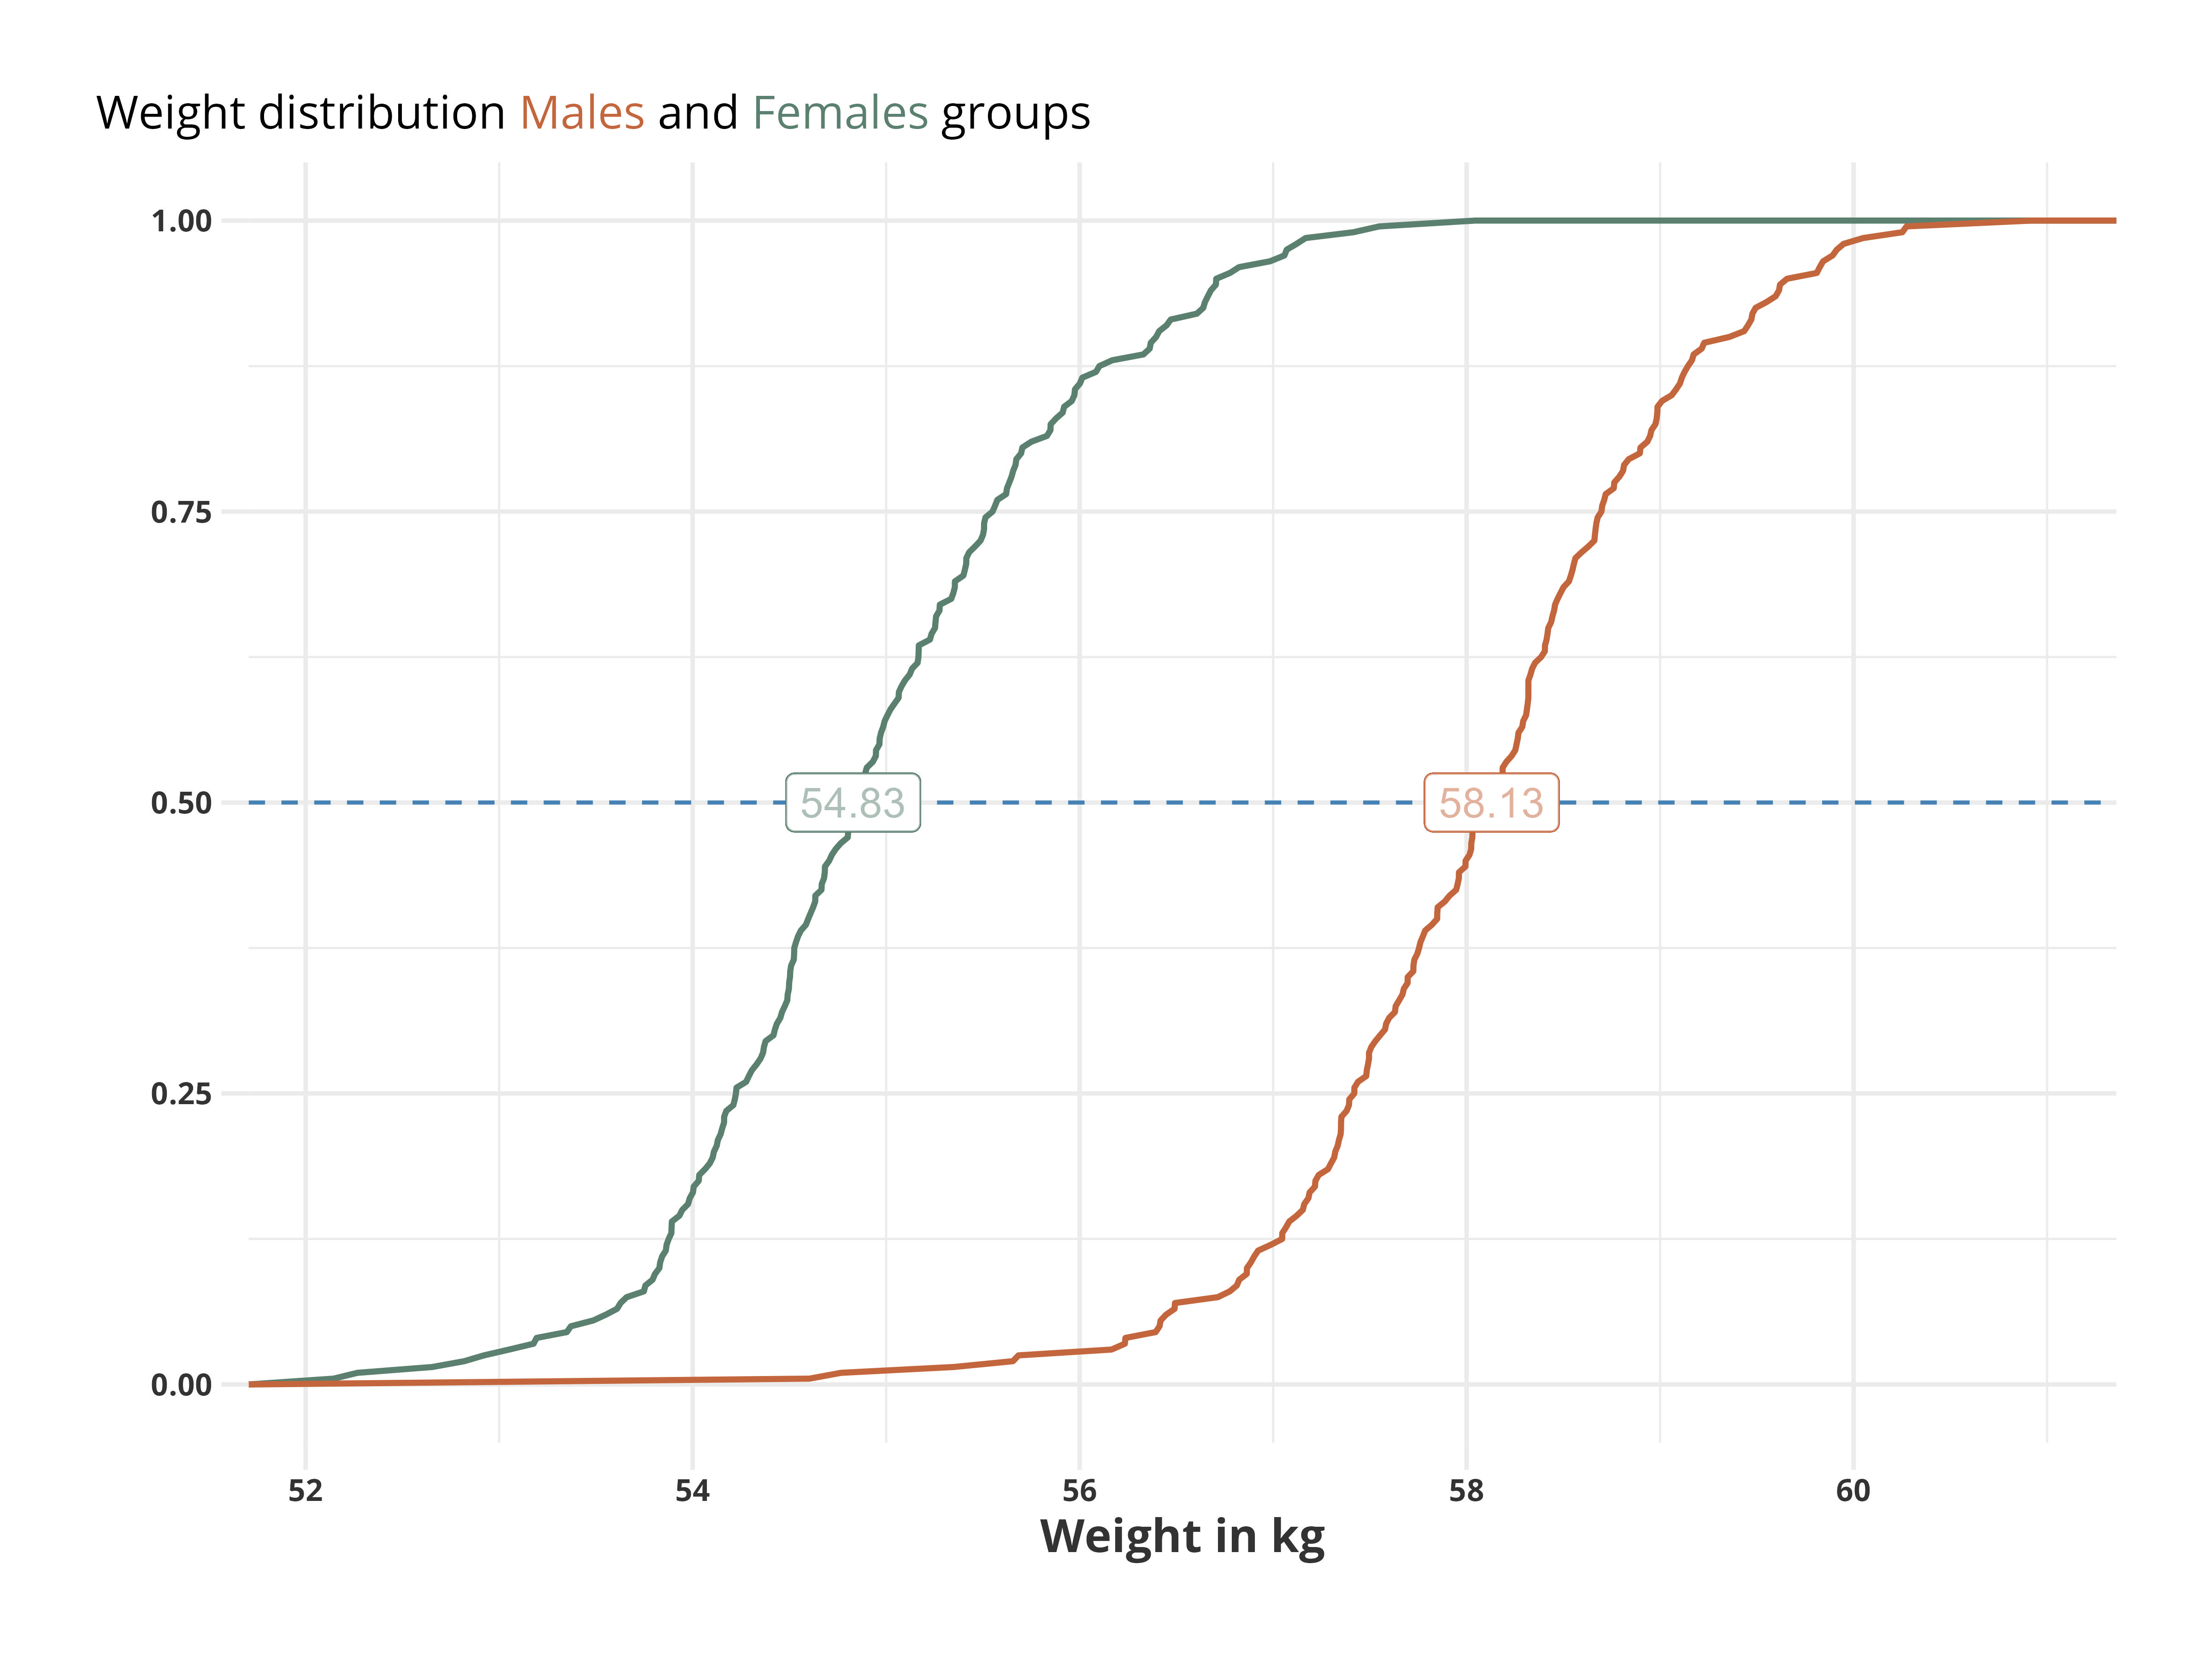
Cumulative distribution
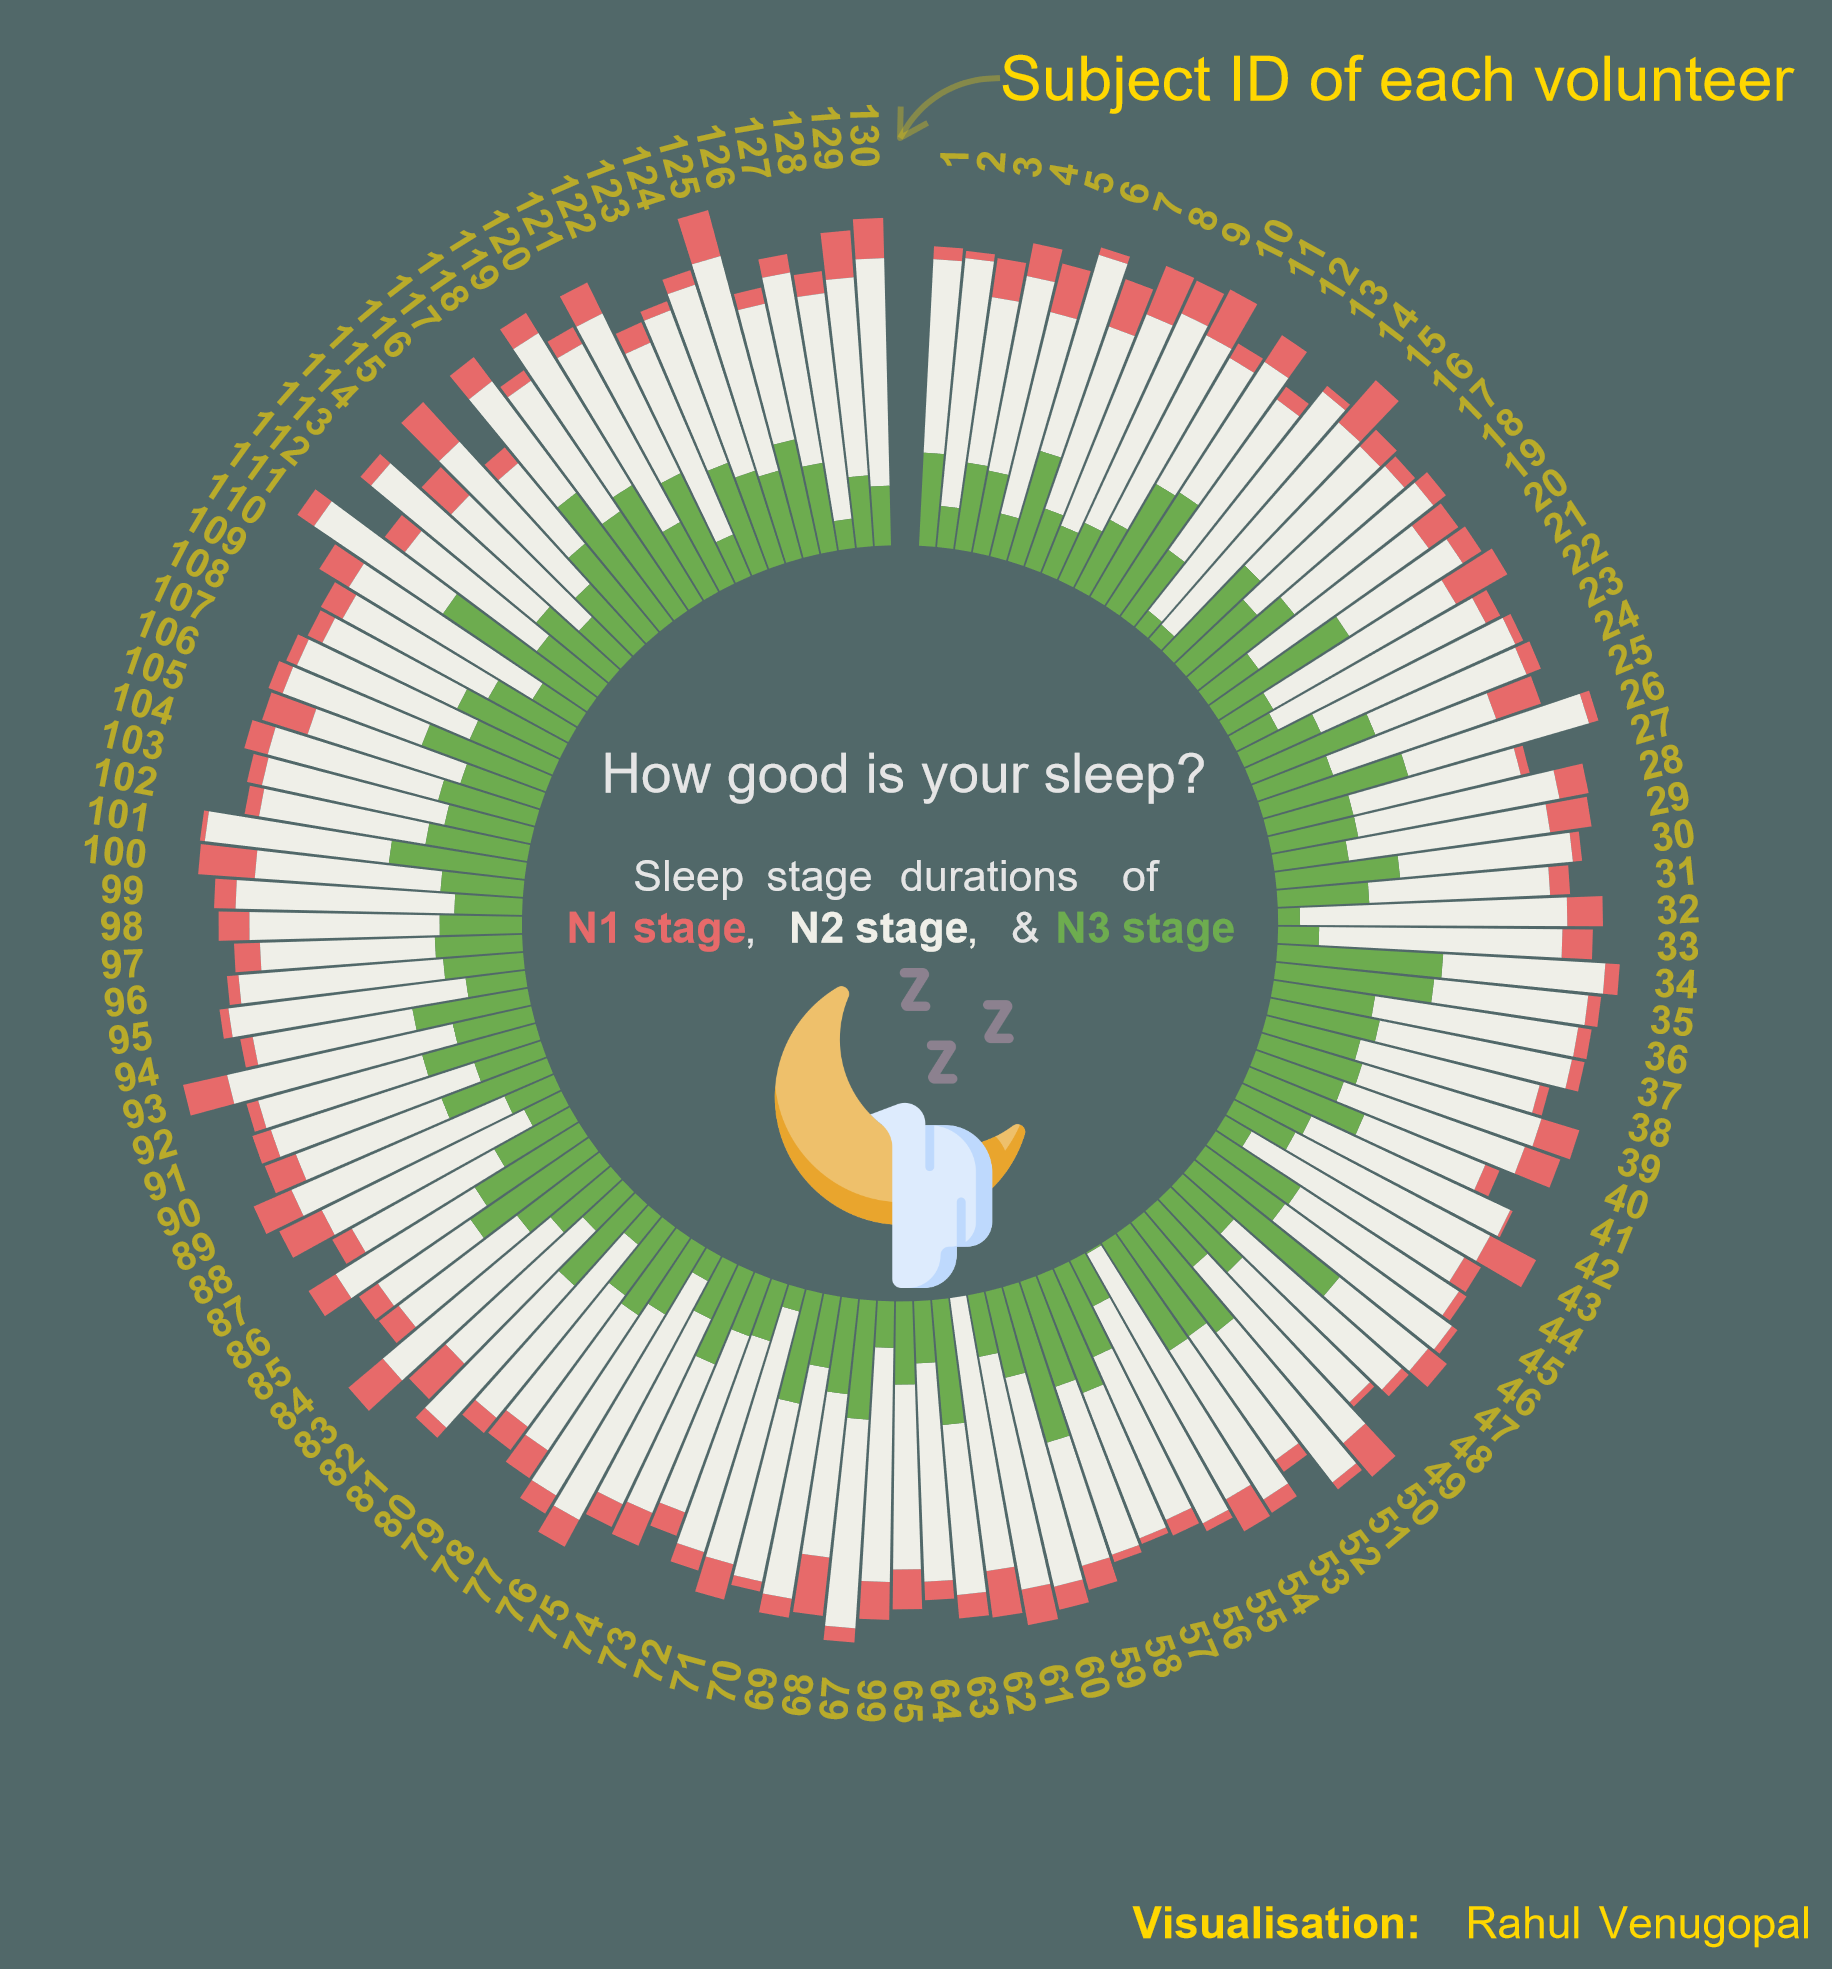
Circular barplot
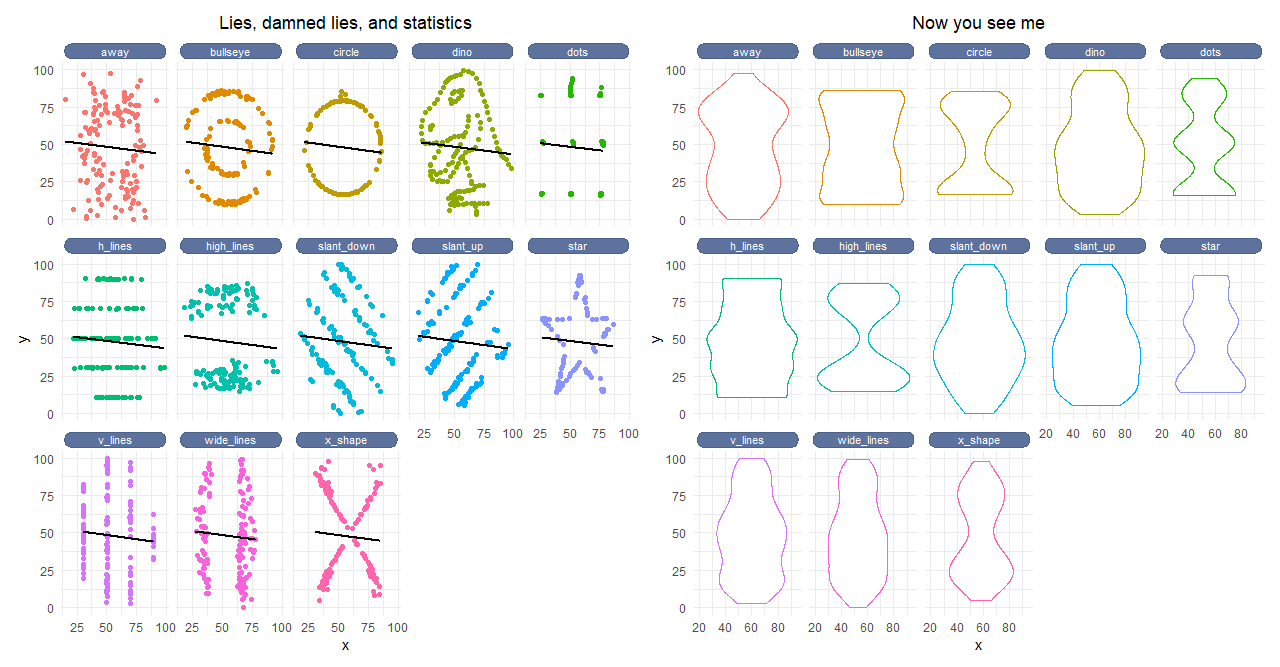
Datasaurus
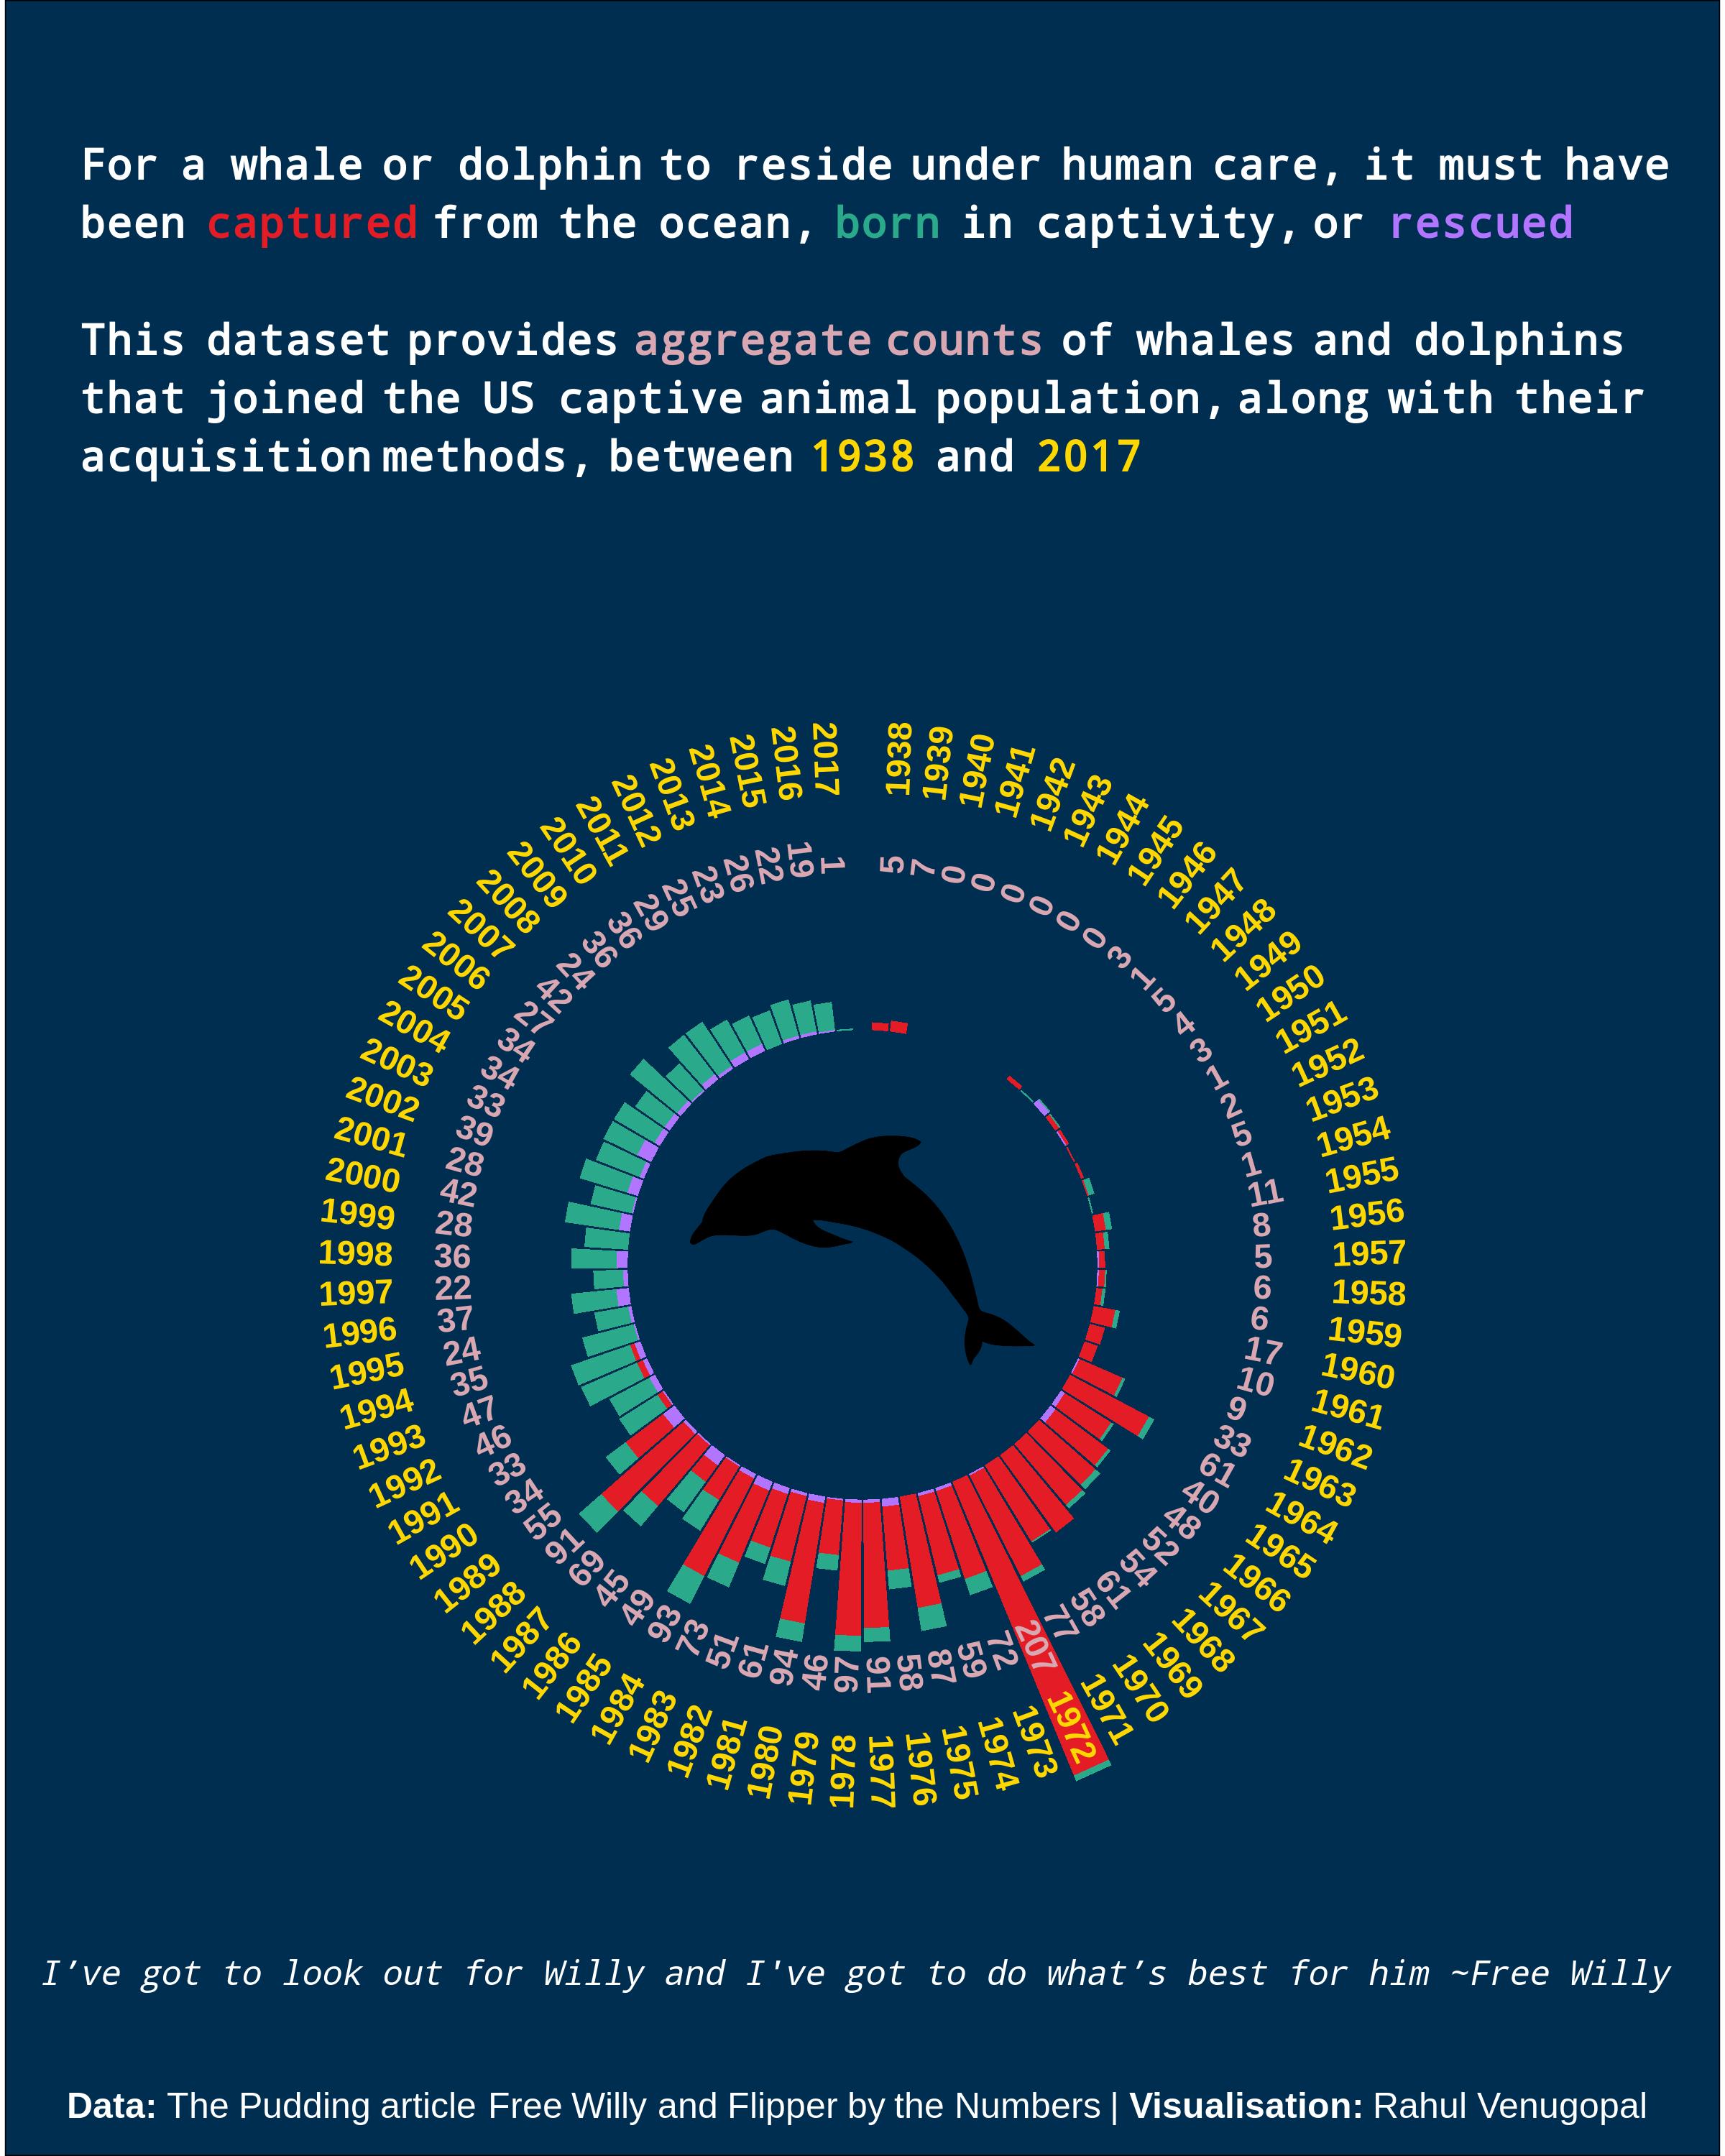
Save cetaceans
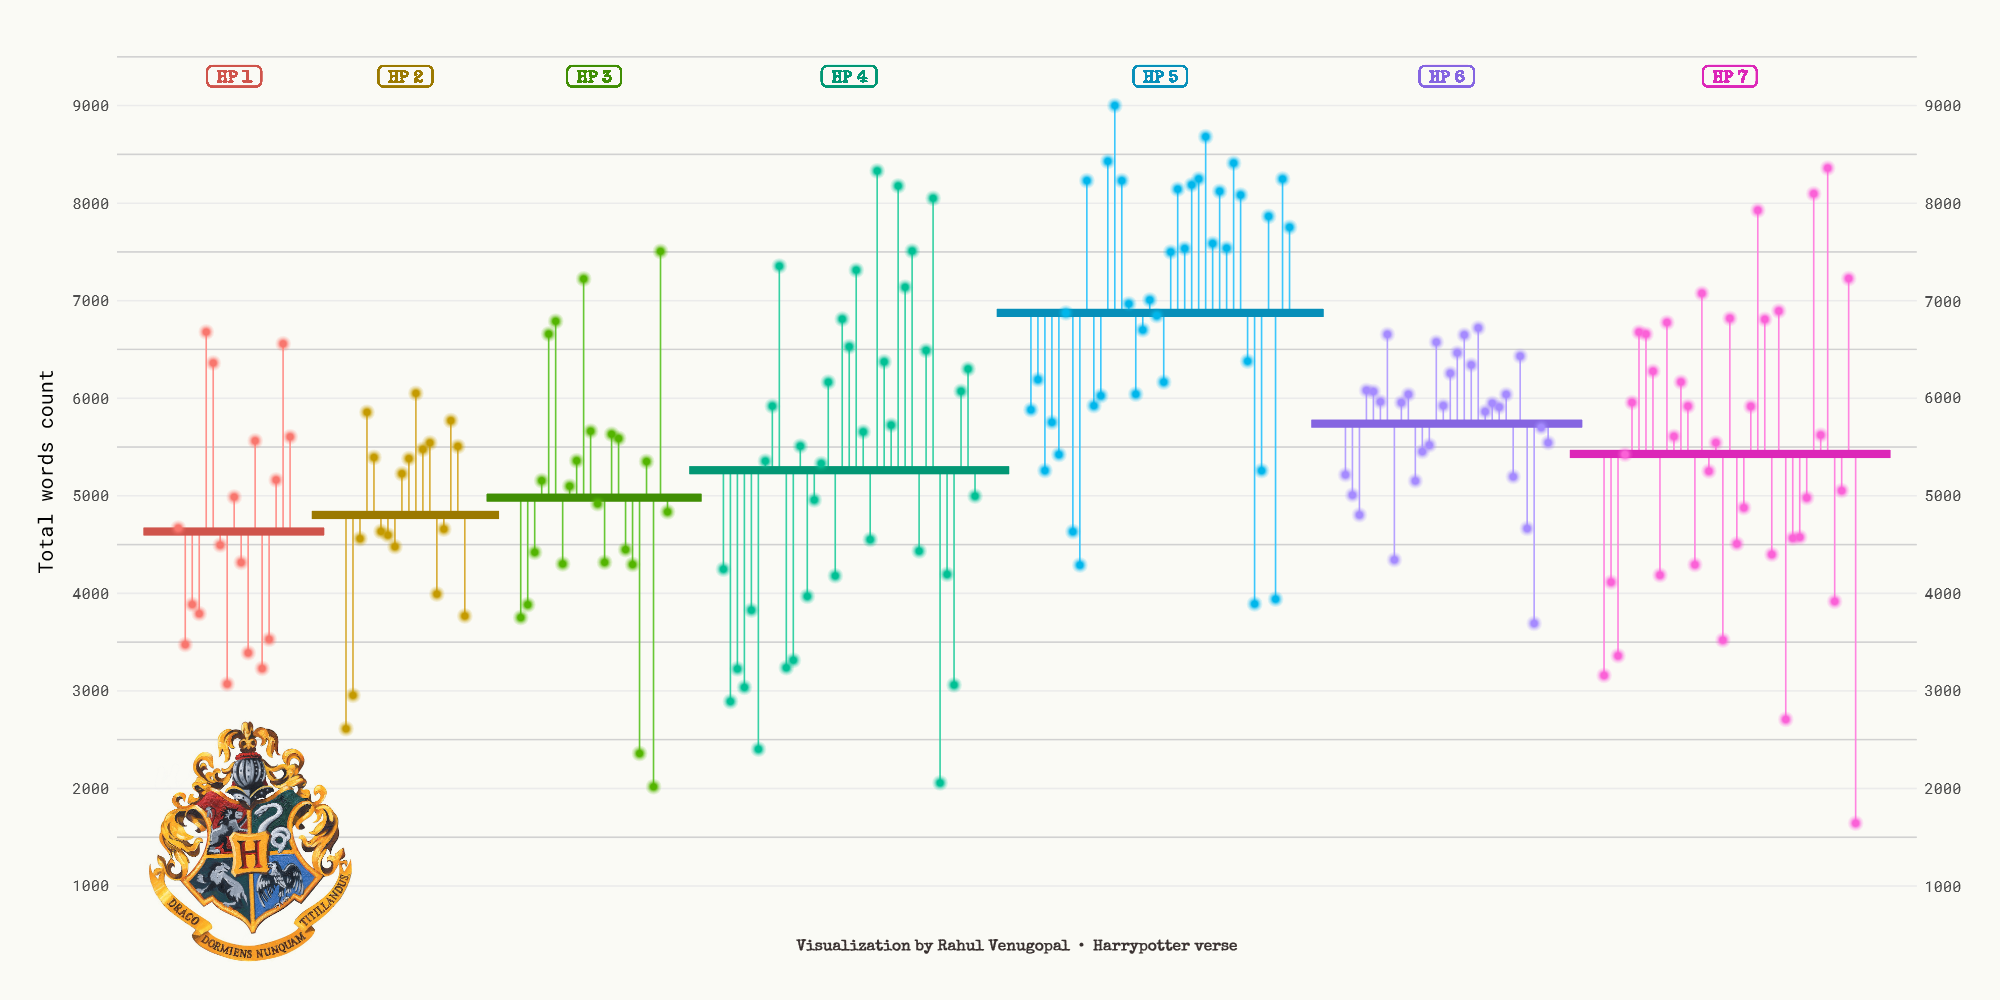
Lollipops and medians
Word cloud
Consistency in batting